Grafana Explore
Grafana Explore enables users to do full PromQL and LogQL queries over logs and metrics and filter on metadata such as workload title or username.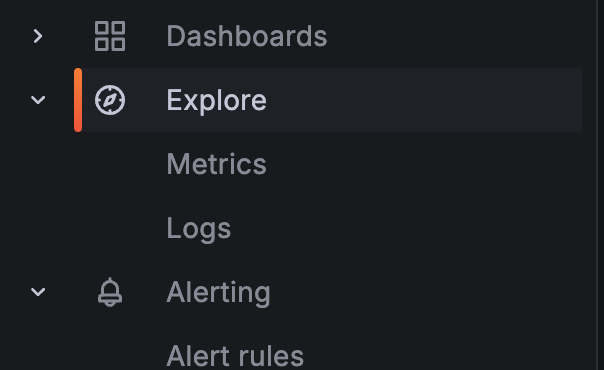
Available Dashboards
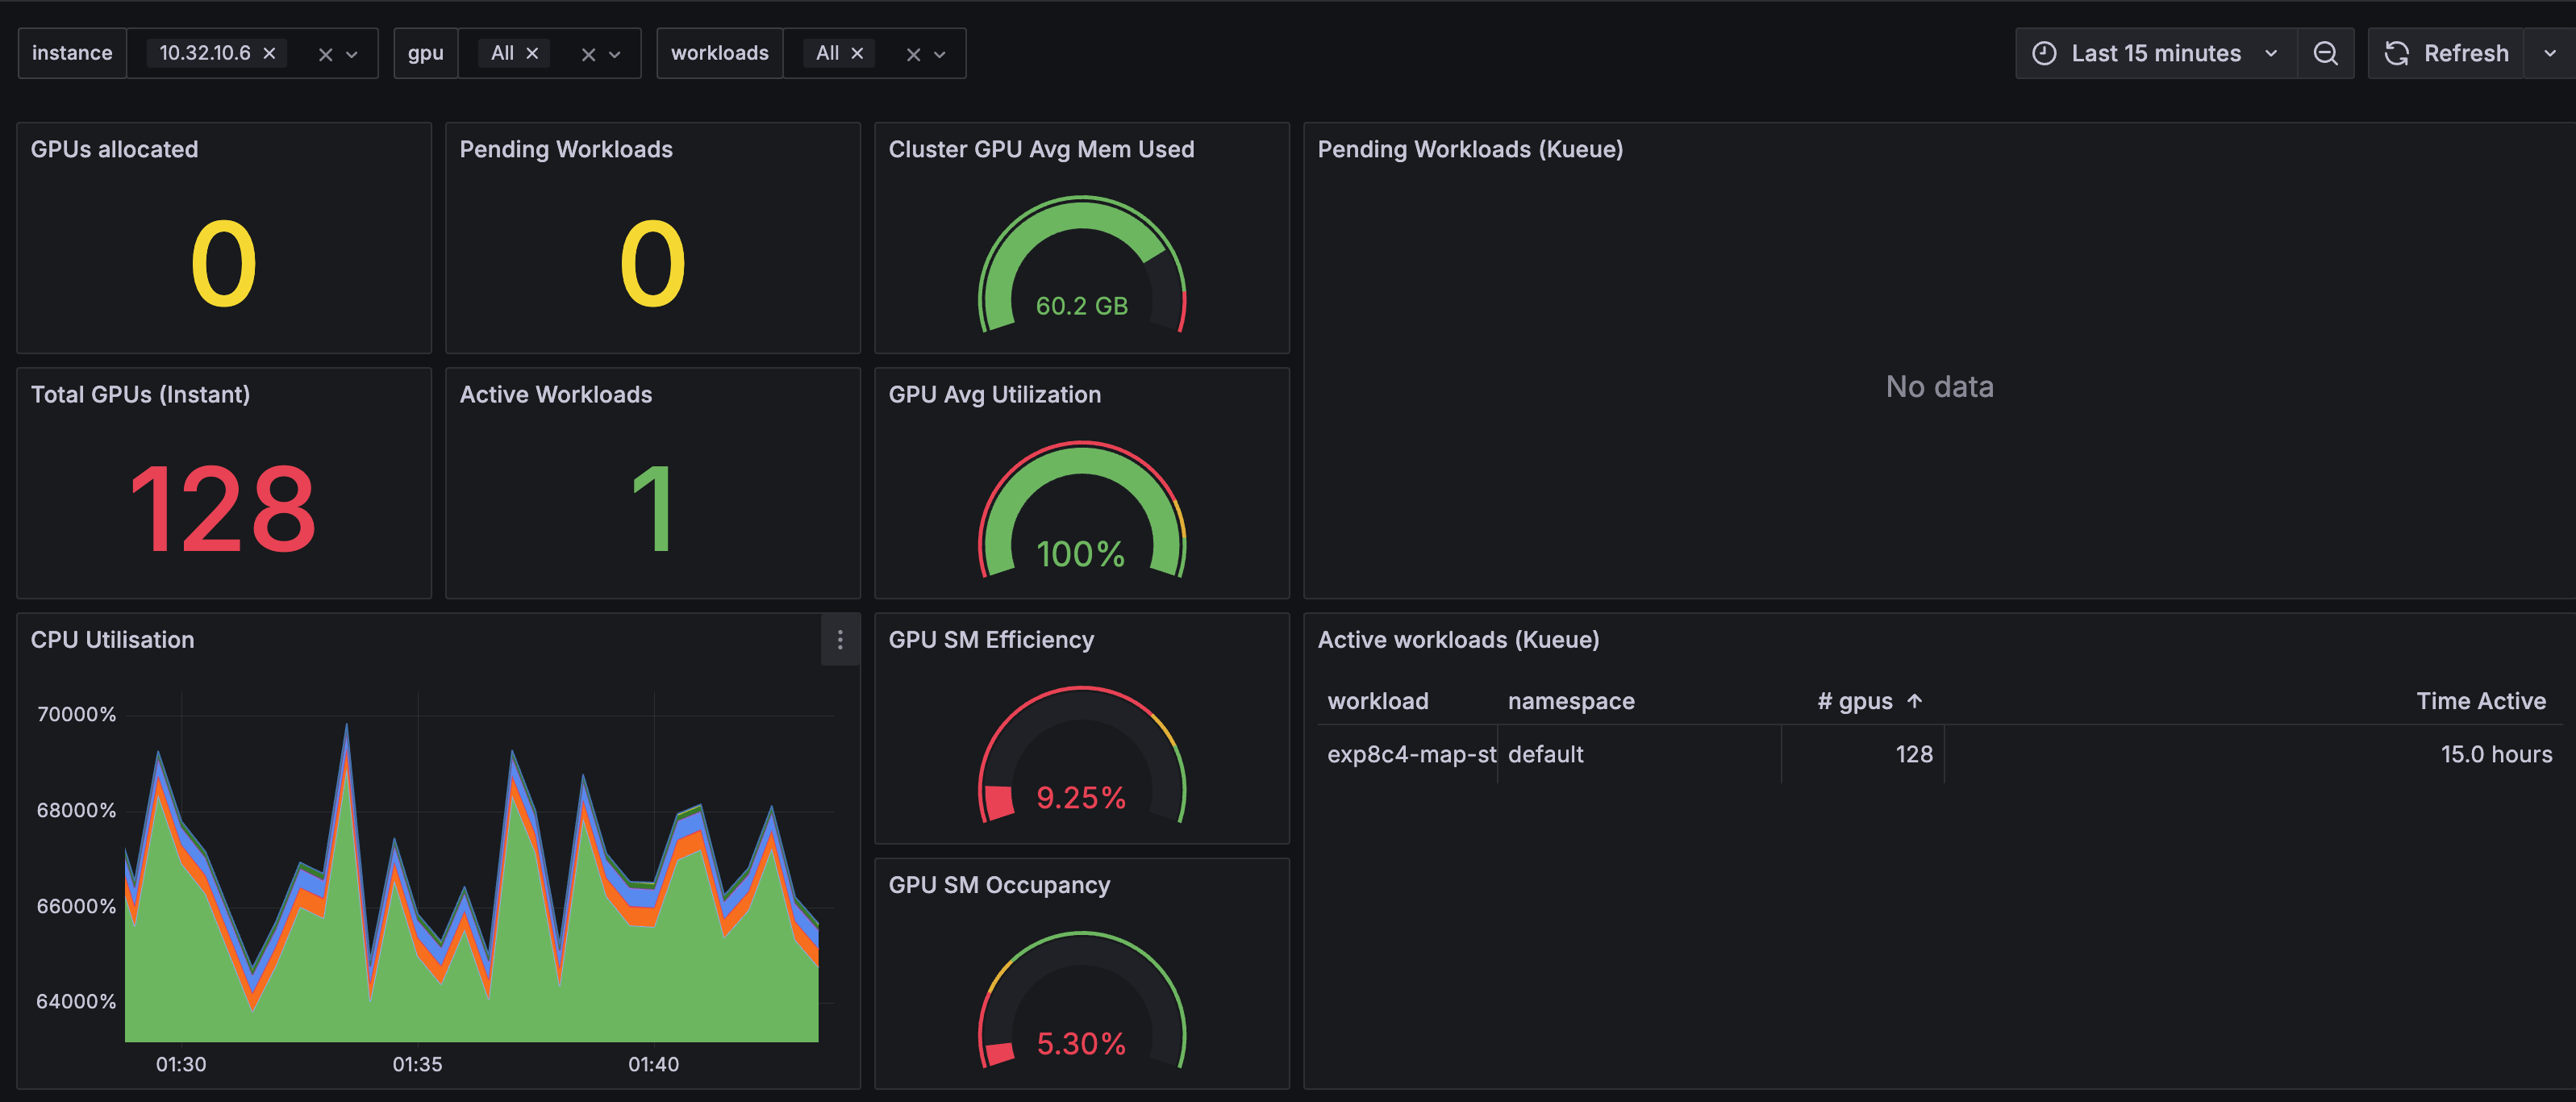
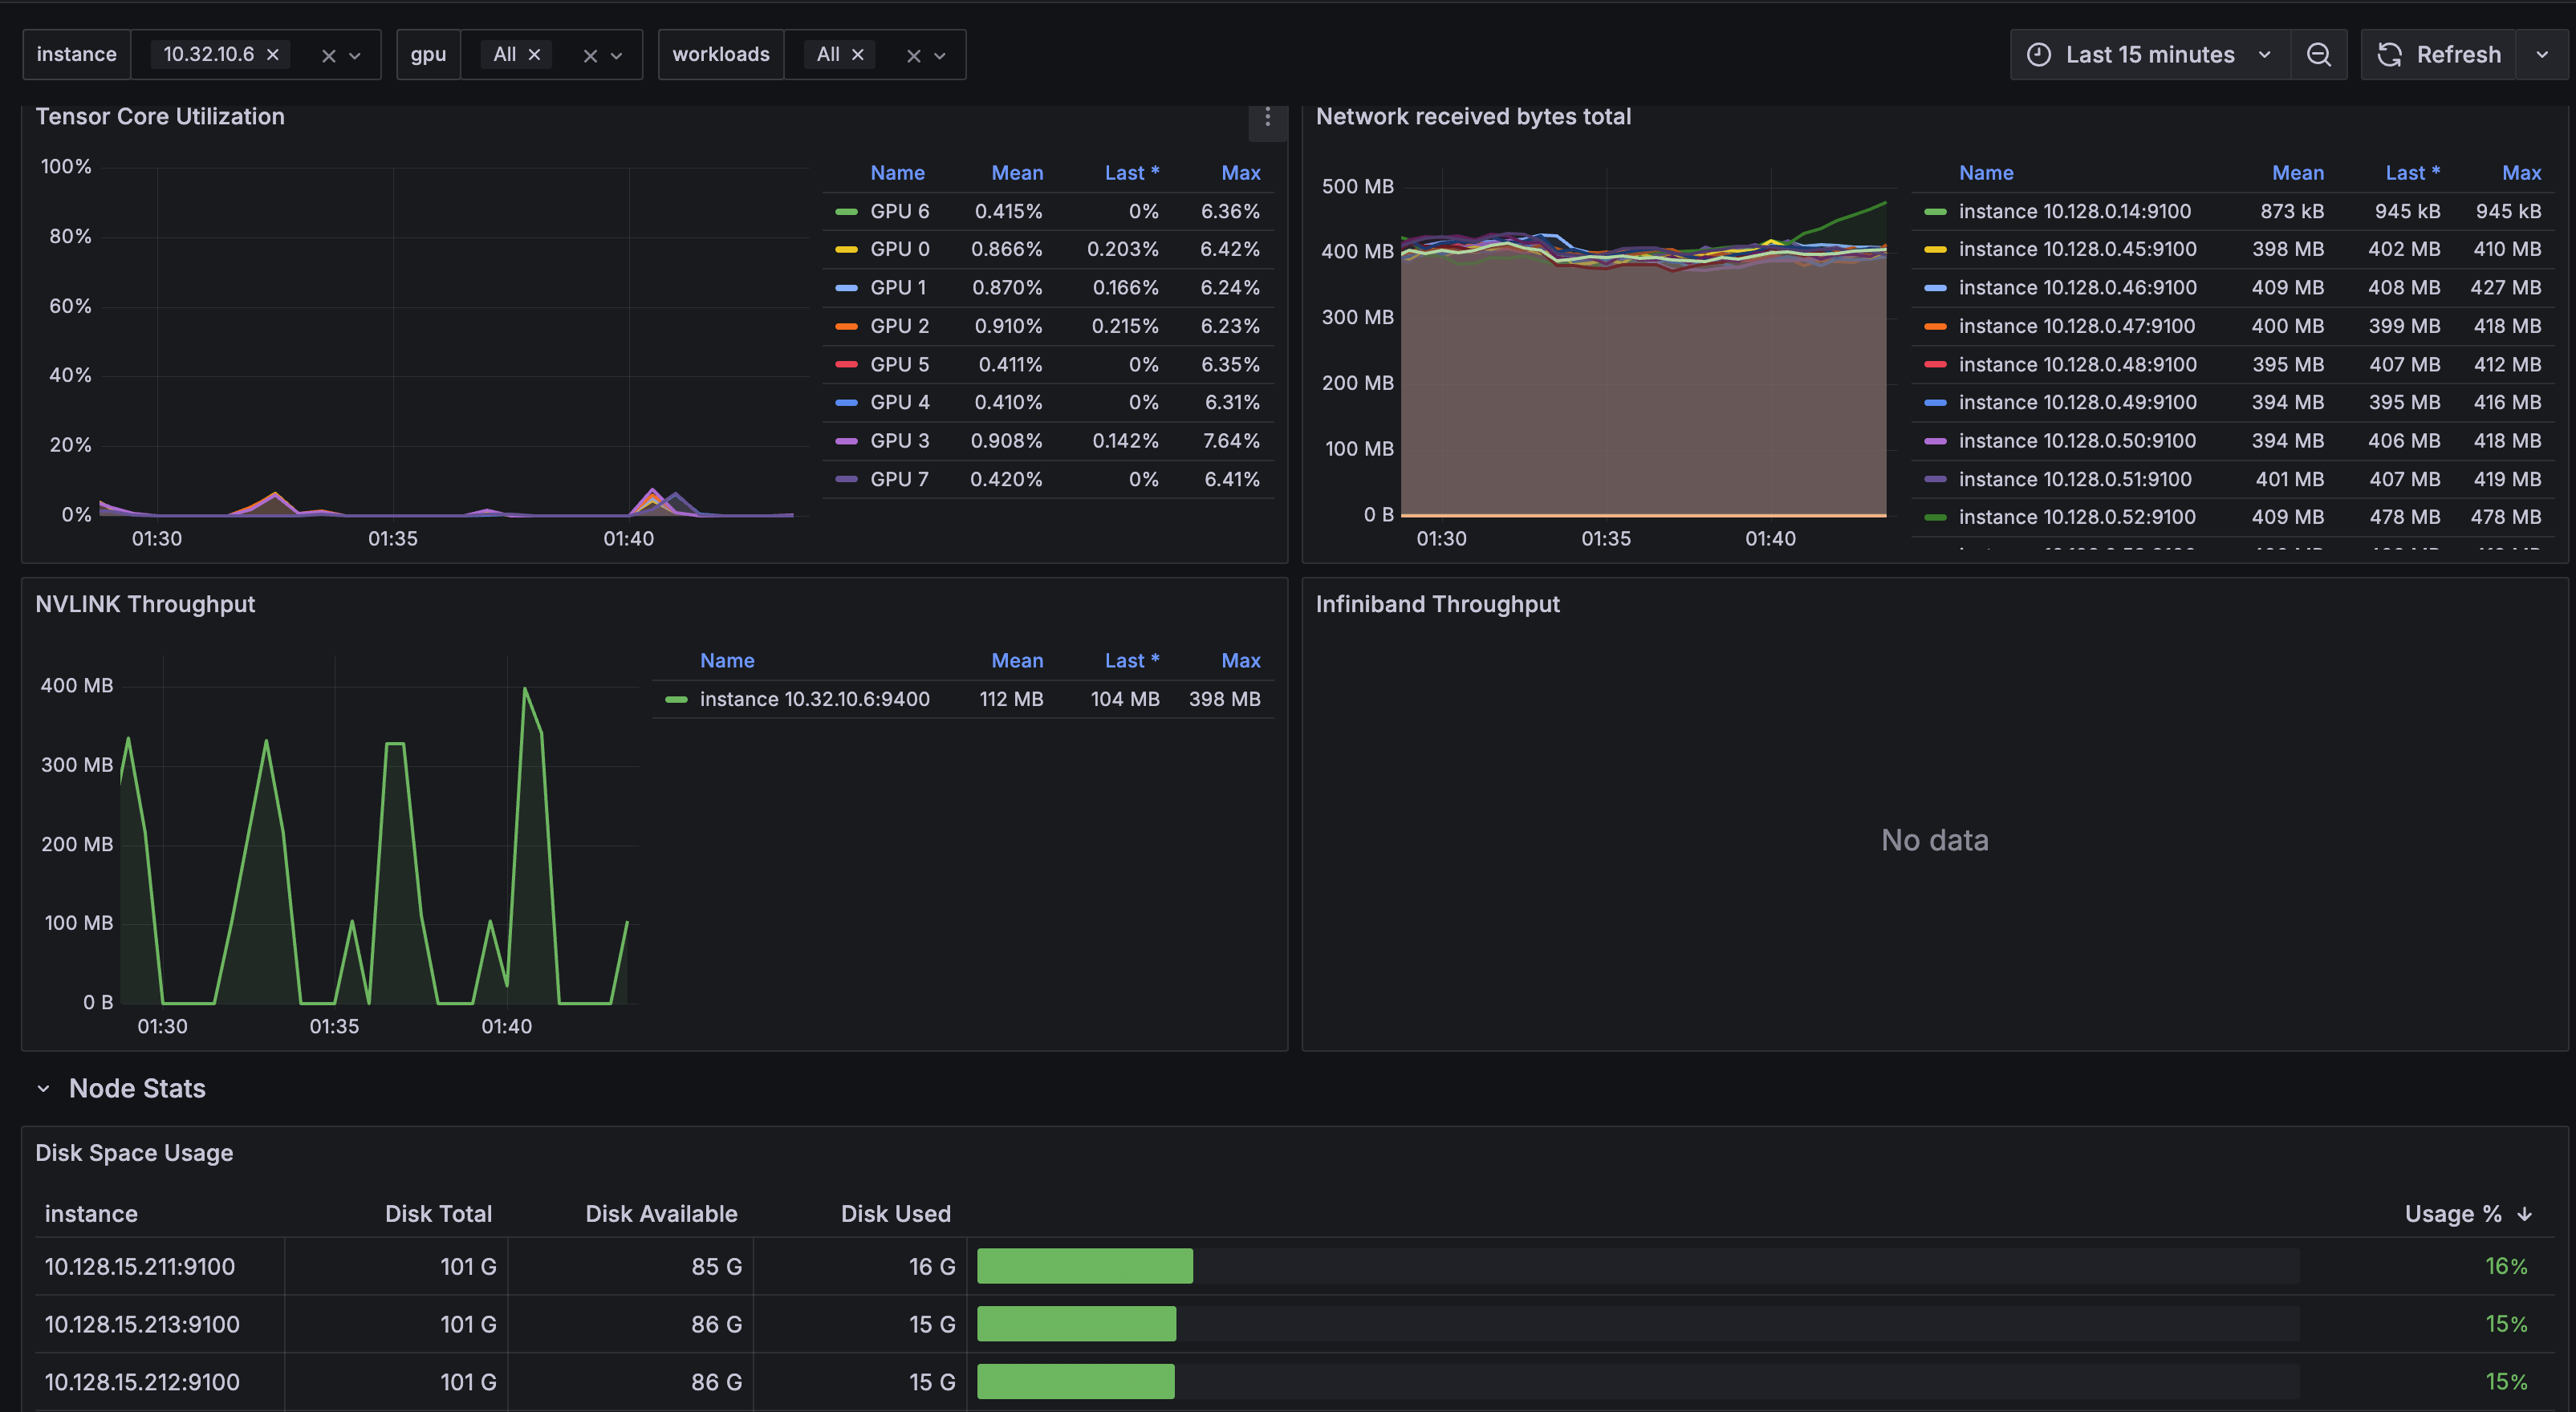
Cluster Overview
The cluster overview dashboard shows overall system utilization such as GPU utilization, efficiency, Infiniband/RoCE throughput, and NVLINK throughput.Cluster view
Cluster view
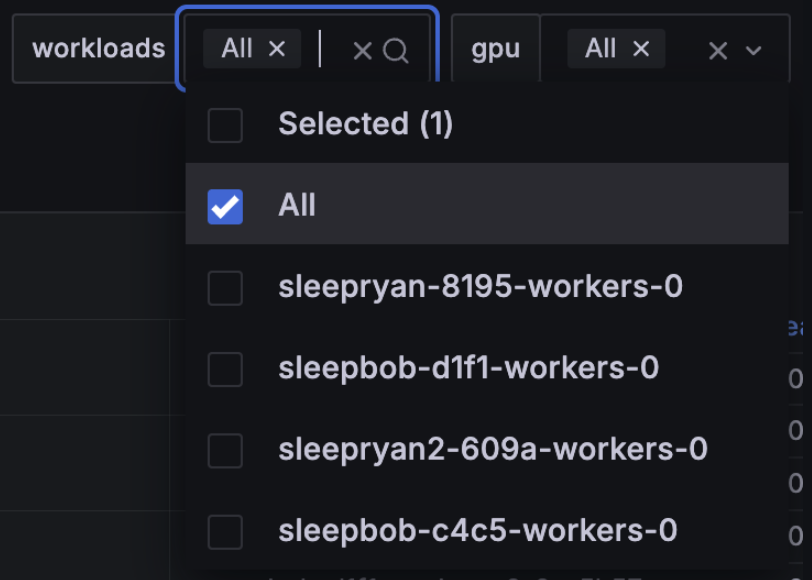
Workload Inspector
The workload inspector (video) allows for filtering of system metrics by workload and username.user filter
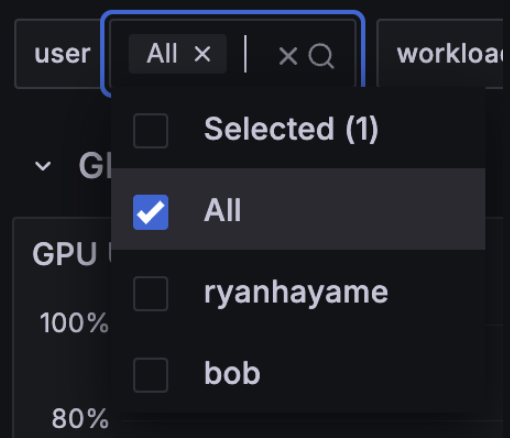
workload filter