
- The dedicated Logs tab — a full-screen viewer for a single run’s
stdout/stderr, described on this page. - Console log widgets — add logs as a file widget to a custom dashboard, to view them alongside metrics and visualizations.
Viewing Logs
To view the logs of an experiment, you can click on the experiment in the list of experiments and then click on the “Logs” tab. You will see something like this: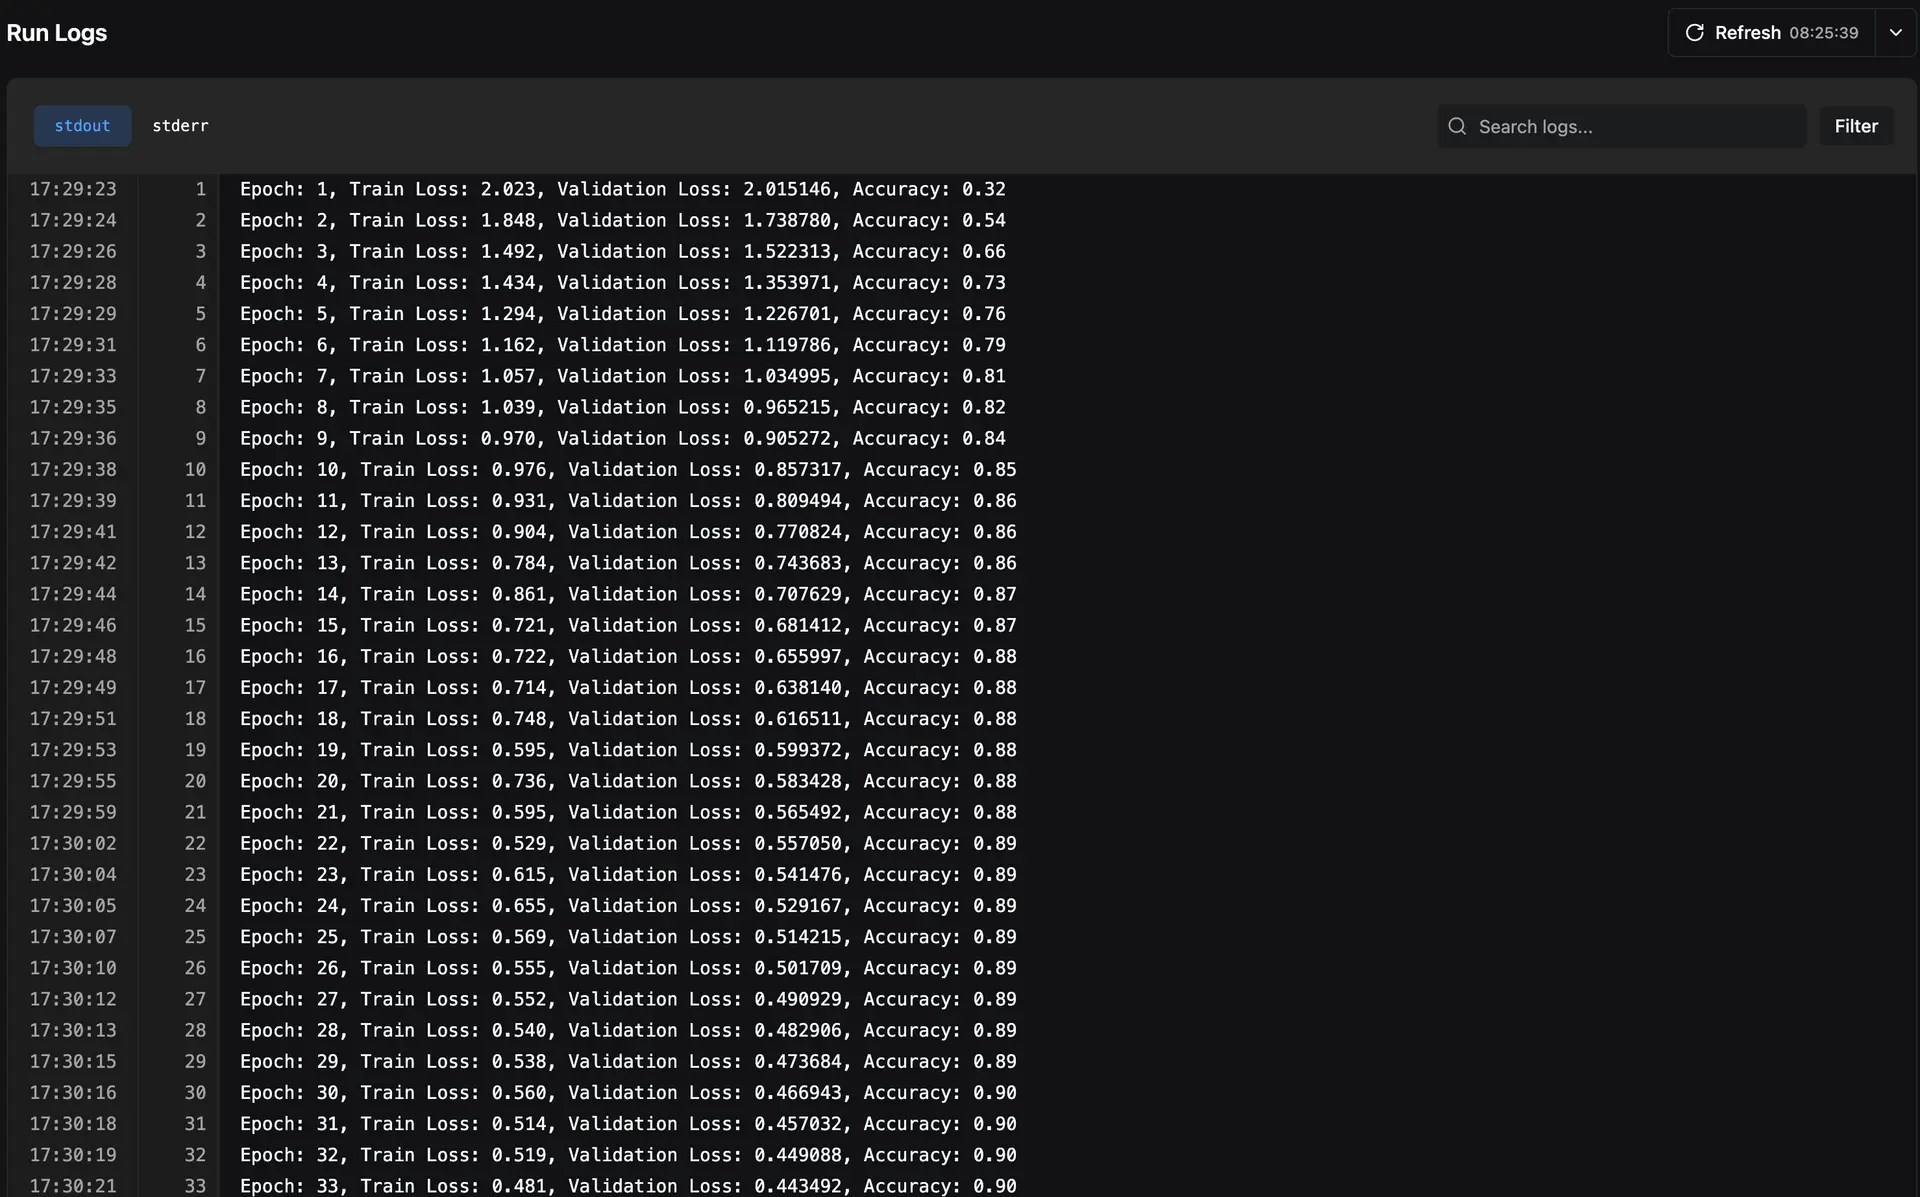
stdout and stderr of your experiments are saved, allowing you to filter out logs based on what you want to see.
Search Modes
The logs viewer supports two search modes:- Filter — Only shows log lines that match your search query, hiding everything else
- Navigate — Highlights matching lines and lets you jump between them with next/previous buttons while keeping the full log context visible
ANSI Color Support
Logs retain ANSI color codes from your terminal output, so colored log messages (e.g., from libraries likerich or colorama) are rendered with their original formatting in the web UI.