> ## Documentation Index
> Fetch the complete documentation index at: https://docs.trainy.ai/llms.txt
> Use this file to discover all available pages before exploring further.
# Histograms
> Log binned distributions with pluto.Histogram.
## Logging
Histogram logging lets you track how distributions of values (such as weight distributions, activation values, or gradient norms) change over training steps.
To log a histogram, instantiate the `pluto.Histogram` class and pass it to `pluto.log`:
```python theme={null}
histogram = pluto.Histogram(
data=values,
bins=64,
)
pluto.log({"layers/layer_0/weights": histogram}, step=epoch)
```
| **Parameter** | **Type** | **Description** |
| ------------- | --------------------------------------- | ------------------------------------------------- |
| `data` | `Union[list, np.ndarray, torch.Tensor]` | The values to build the histogram from. |
| `bins` | `int` | Number of bins for the histogram. Defaults to 64. |
### Examples
#### Logging Weight Distributions
```python theme={null}
import pluto
import torch
run = pluto.init(project="my-project")
model = MyModel()
for epoch in range(num_epochs):
# ... training step ...
# Log weight distributions for each layer
for name, param in model.named_parameters():
if "weight" in name:
pluto.log({f"histograms/{name}": pluto.Histogram(param.data.cpu())}, step=epoch)
```
#### Logging Gradient Distributions
```python theme={null}
for name, param in model.named_parameters():
if param.grad is not None:
pluto.log({
f"gradients/{name}": pluto.Histogram(param.grad.data.cpu(), bins=32)
}, step=epoch)
```
## Viewing
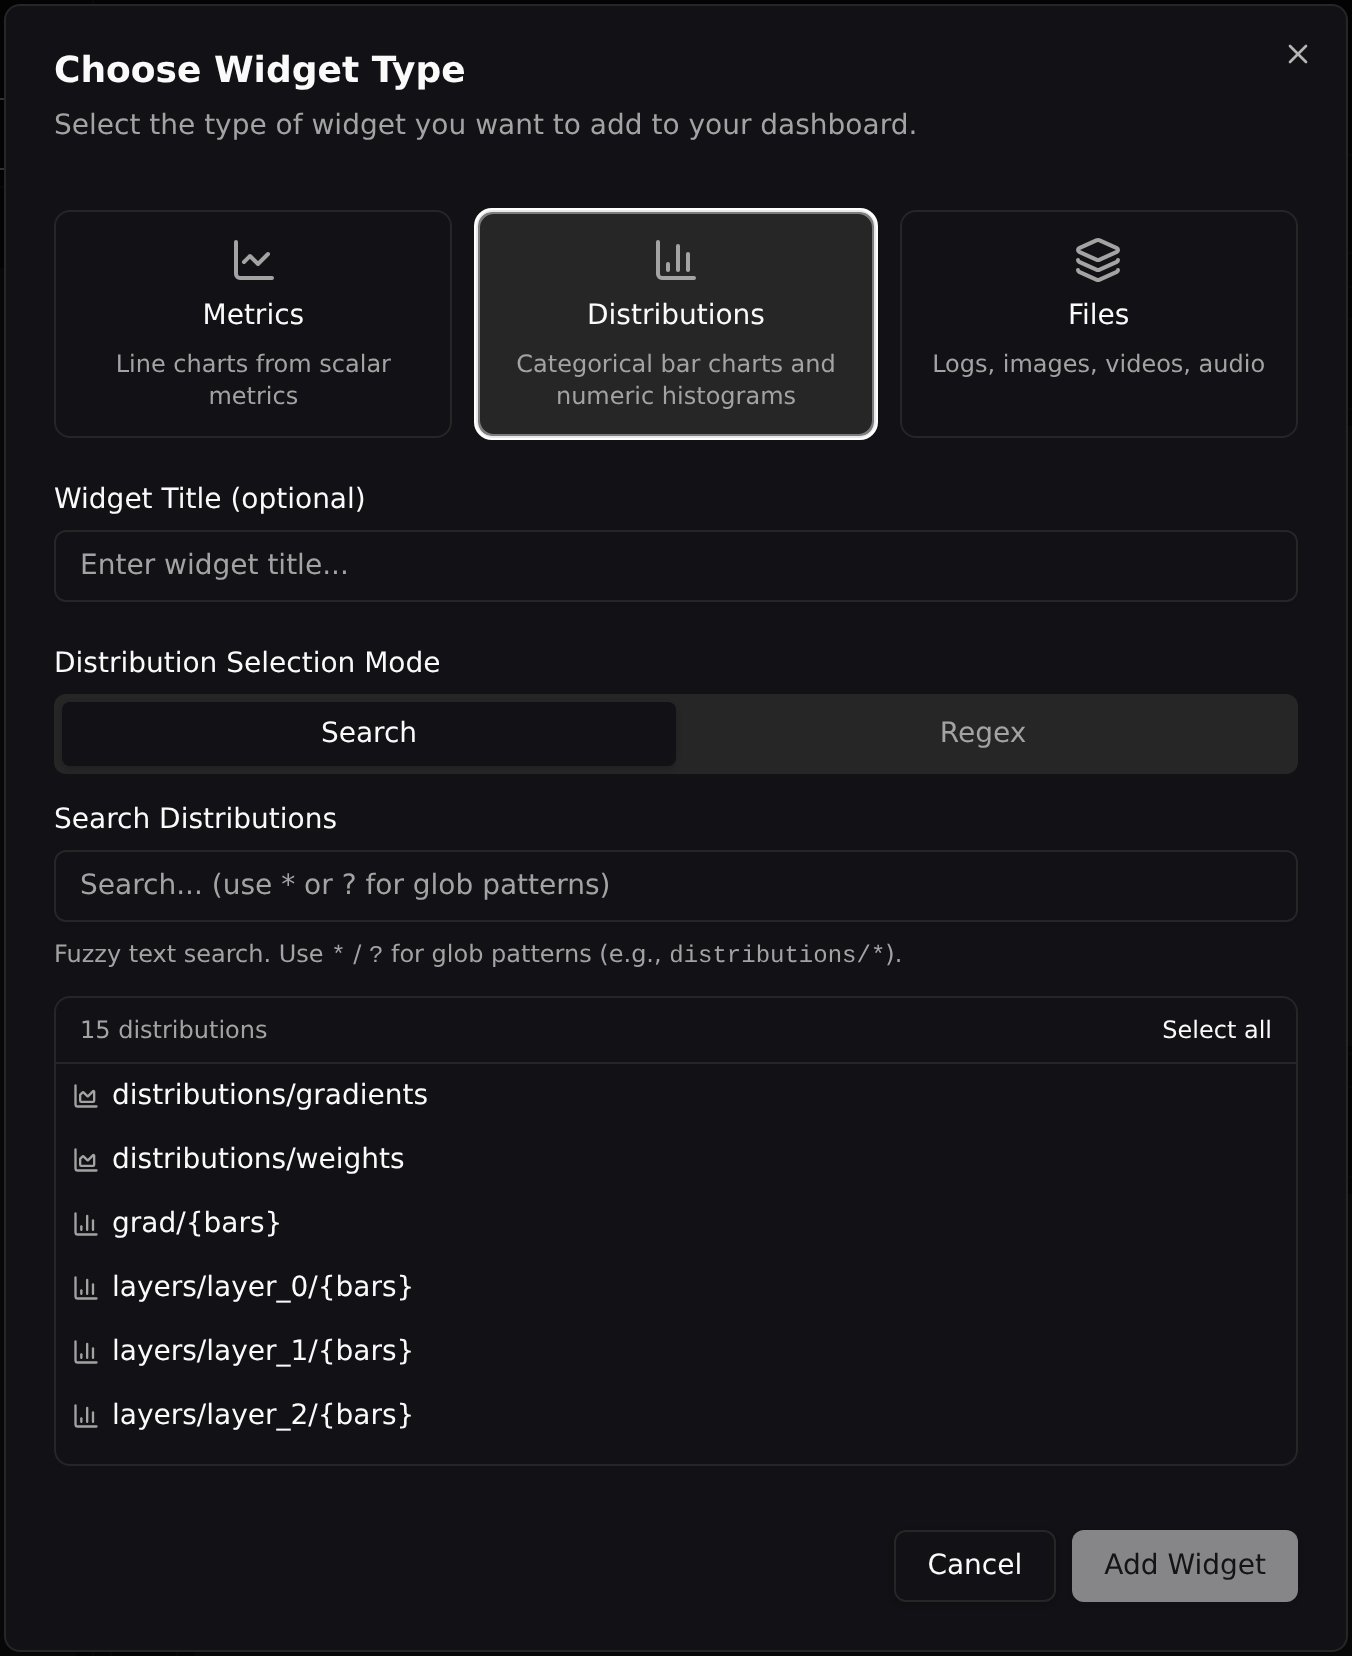
Histograms render in the **Distributions** widget, which also hosts categorical [bar charts](/pluto/visualizations/bar-charts). To add one to a dashboard, open **Add Widget**, choose the **Distributions** tab, and search for your histogram log name (e.g. `distributions/weights`).
 ### View modes
Each widget renders in one of three modes.
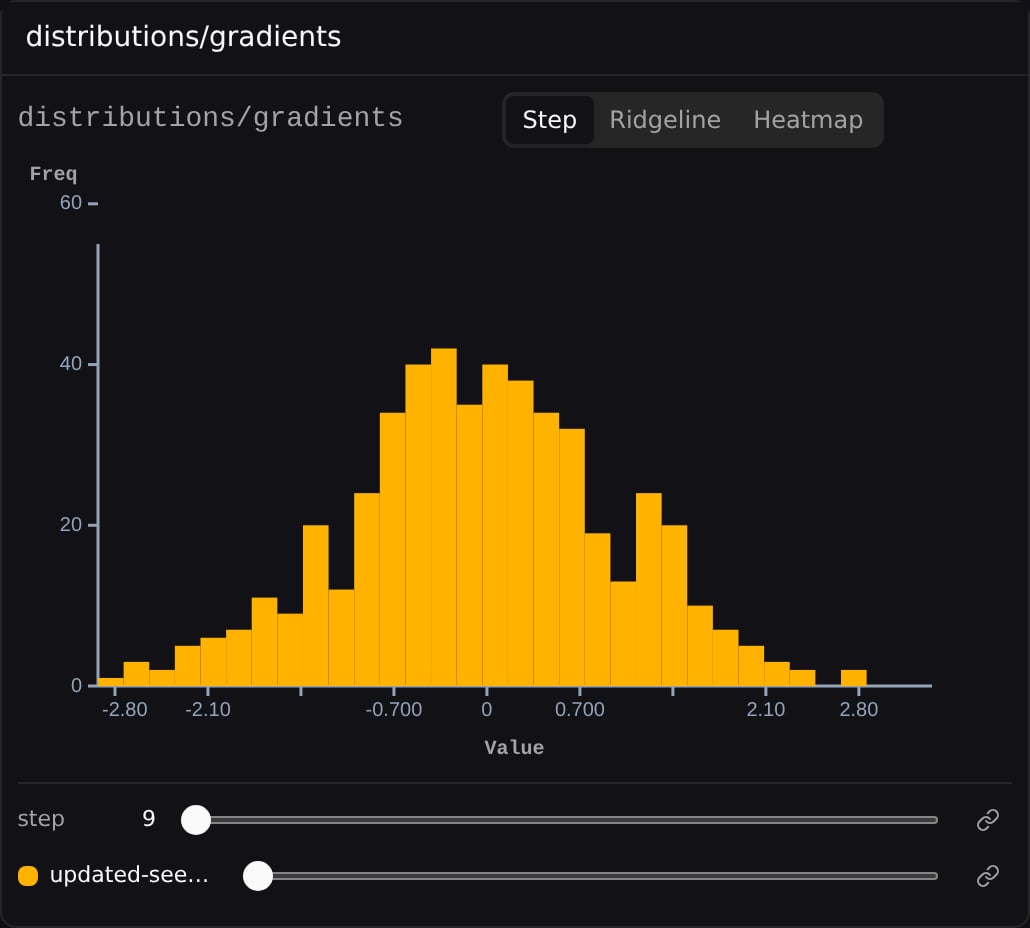
**Step** — a bar chart of the current step's frequencies. Use the step slider below the widget to scrub through training; when several widgets share a section, their sliders can be **linked** via the **lock icon** so they move together.
### View modes
Each widget renders in one of three modes.
**Step** — a bar chart of the current step's frequencies. Use the step slider below the widget to scrub through training; when several widgets share a section, their sliders can be **linked** via the **lock icon** so they move together.
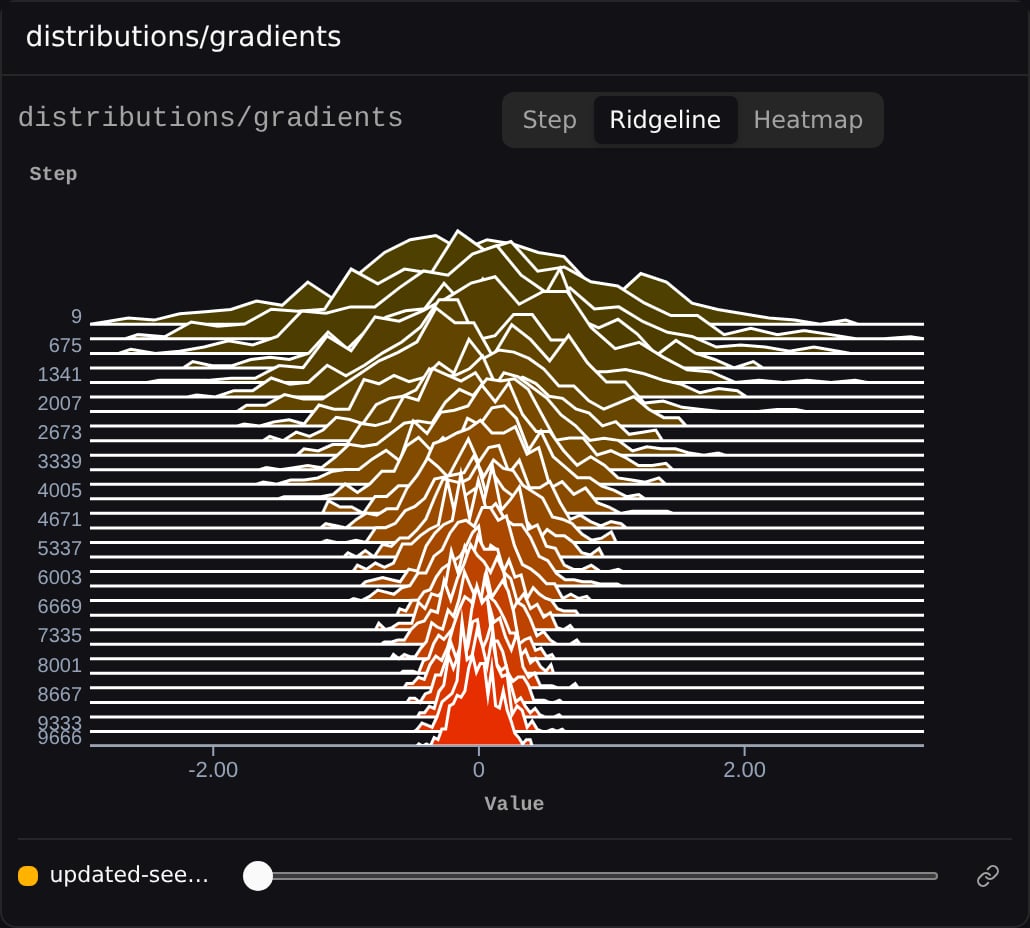
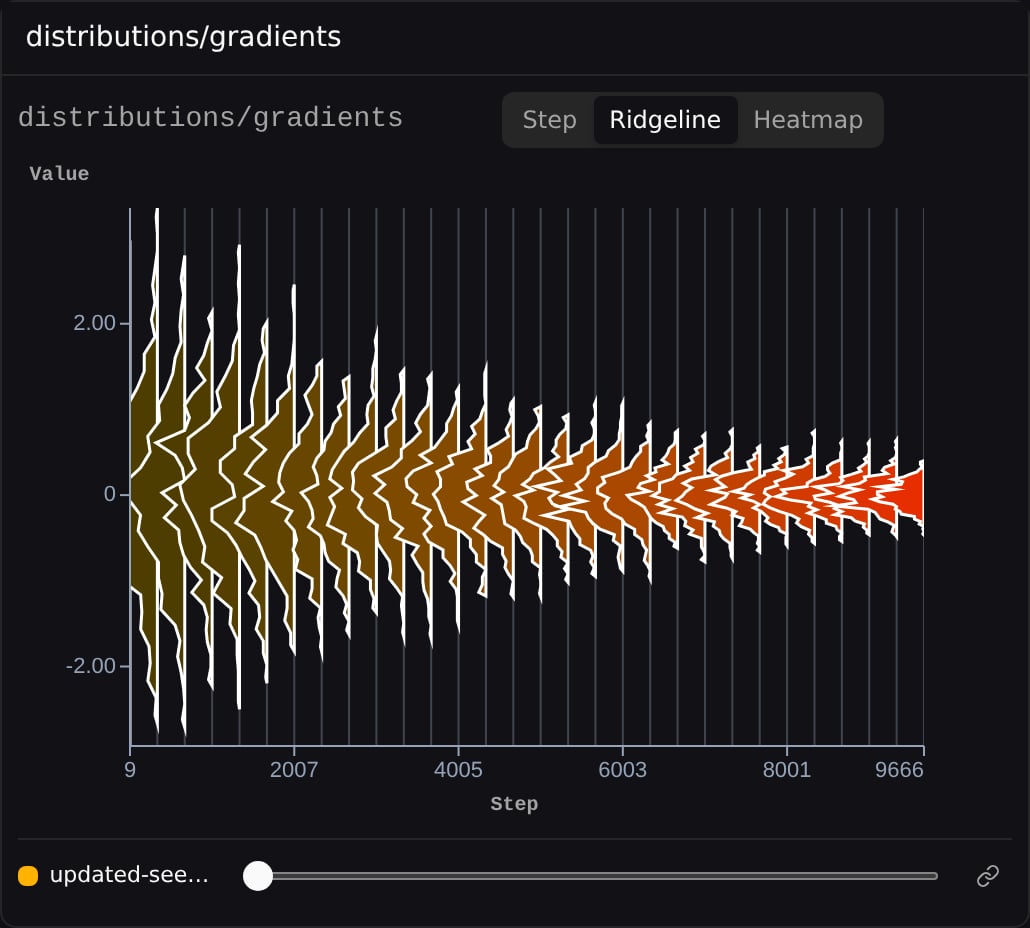
 **Ridgeline** — one density curve (joyplot) per step, stacked so you can watch the distribution evolve over training.
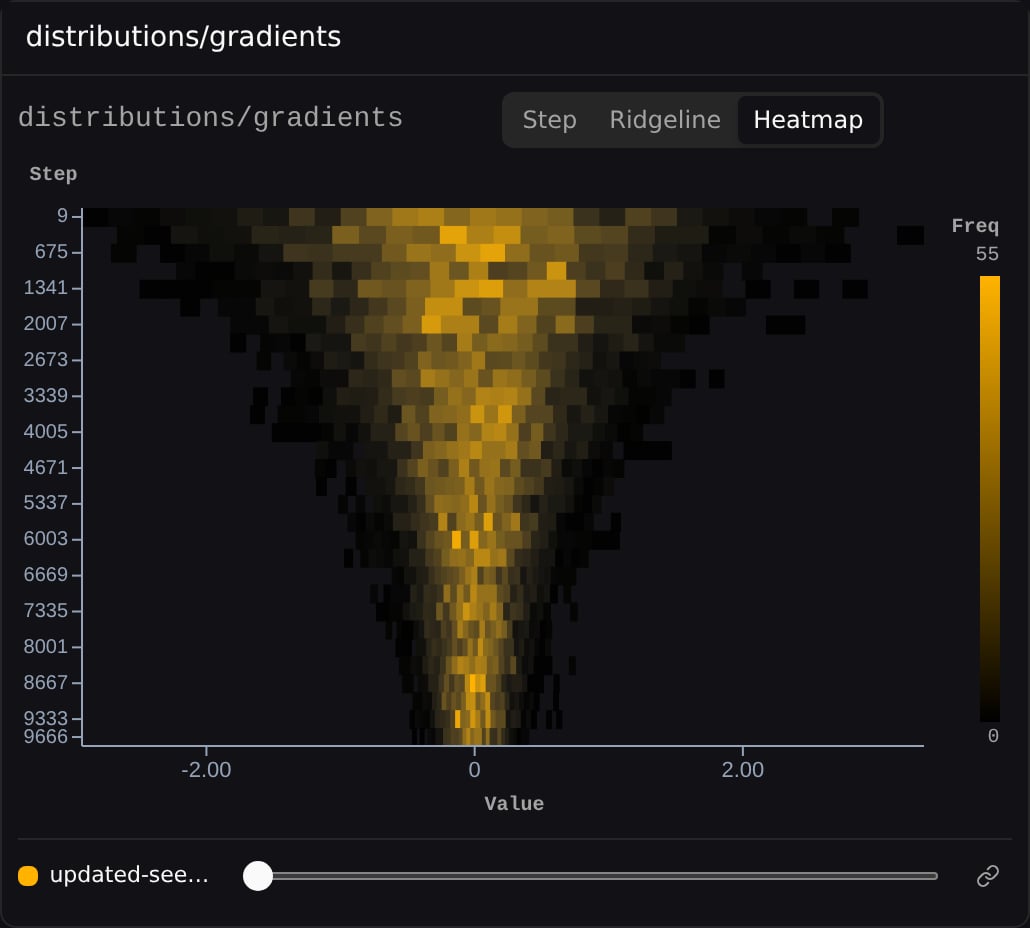
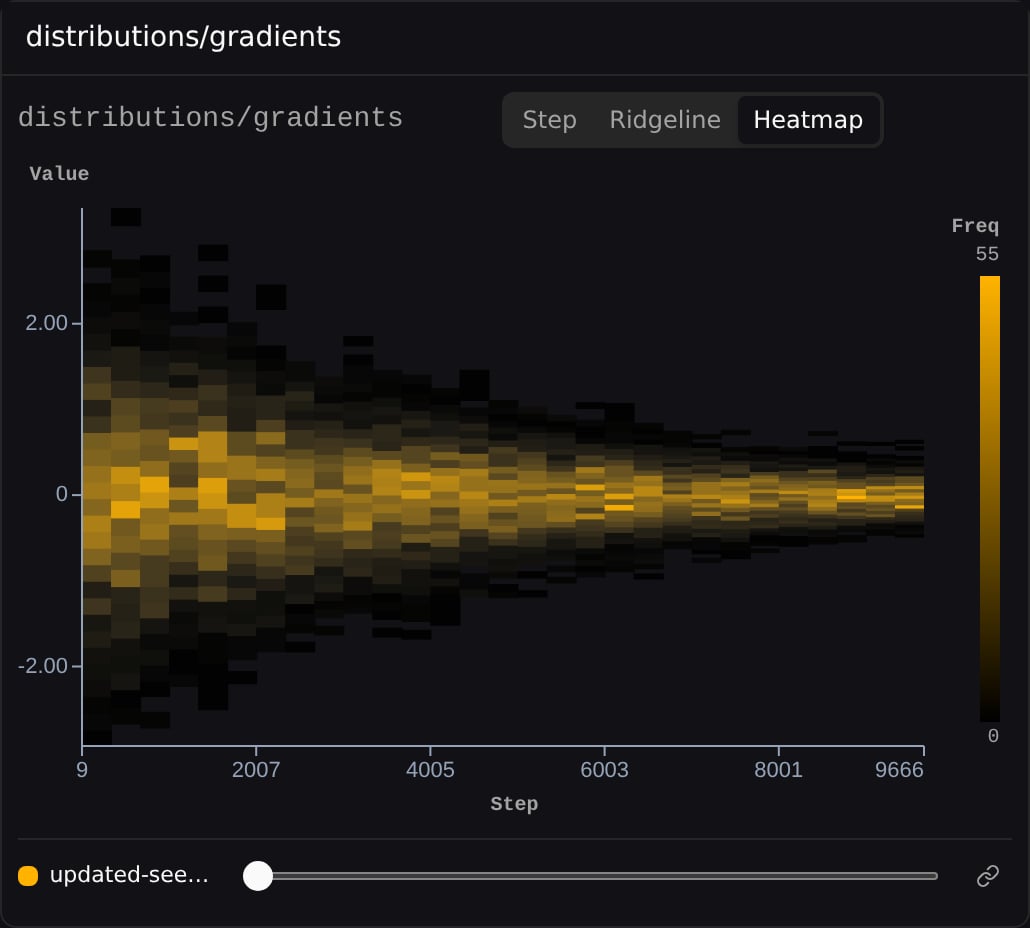
 **Heatmap** — a density grid with frequency as color, the numeric bin on the X axis and step on the Y axis.
 ### Steps on X
In Ridgeline and Heatmap modes, a **Steps on X** toggle in the settings popover transposes the chart so steps run along the X axis.
### Steps on X
In Ridgeline and Heatmap modes, a **Steps on X** toggle in the settings popover transposes the chart so steps run along the X axis.
 The same transpose applies in Heatmap mode:
 ### Settings
Open the settings popover (the sliders icon, shown on hover) to adjust:
* **X min** / **X max** — pin the X axis to manual bounds instead of the per-run **Auto** range.
* **Y max** — manual Y bound (Step mode only).
* **Ignore outliers** — clamp the axis and frequency scale so one extreme step doesn't flatten the rest (on by default).
### Settings
Open the settings popover (the sliders icon, shown on hover) to adjust:
* **X min** / **X max** — pin the X axis to manual bounds instead of the per-run **Auto** range.
* **Y max** — manual Y bound (Step mode only).
* **Ignore outliers** — clamp the axis and frequency scale so one extreme step doesn't flatten the rest (on by default).